Posts - Page 10 (page 10)
-
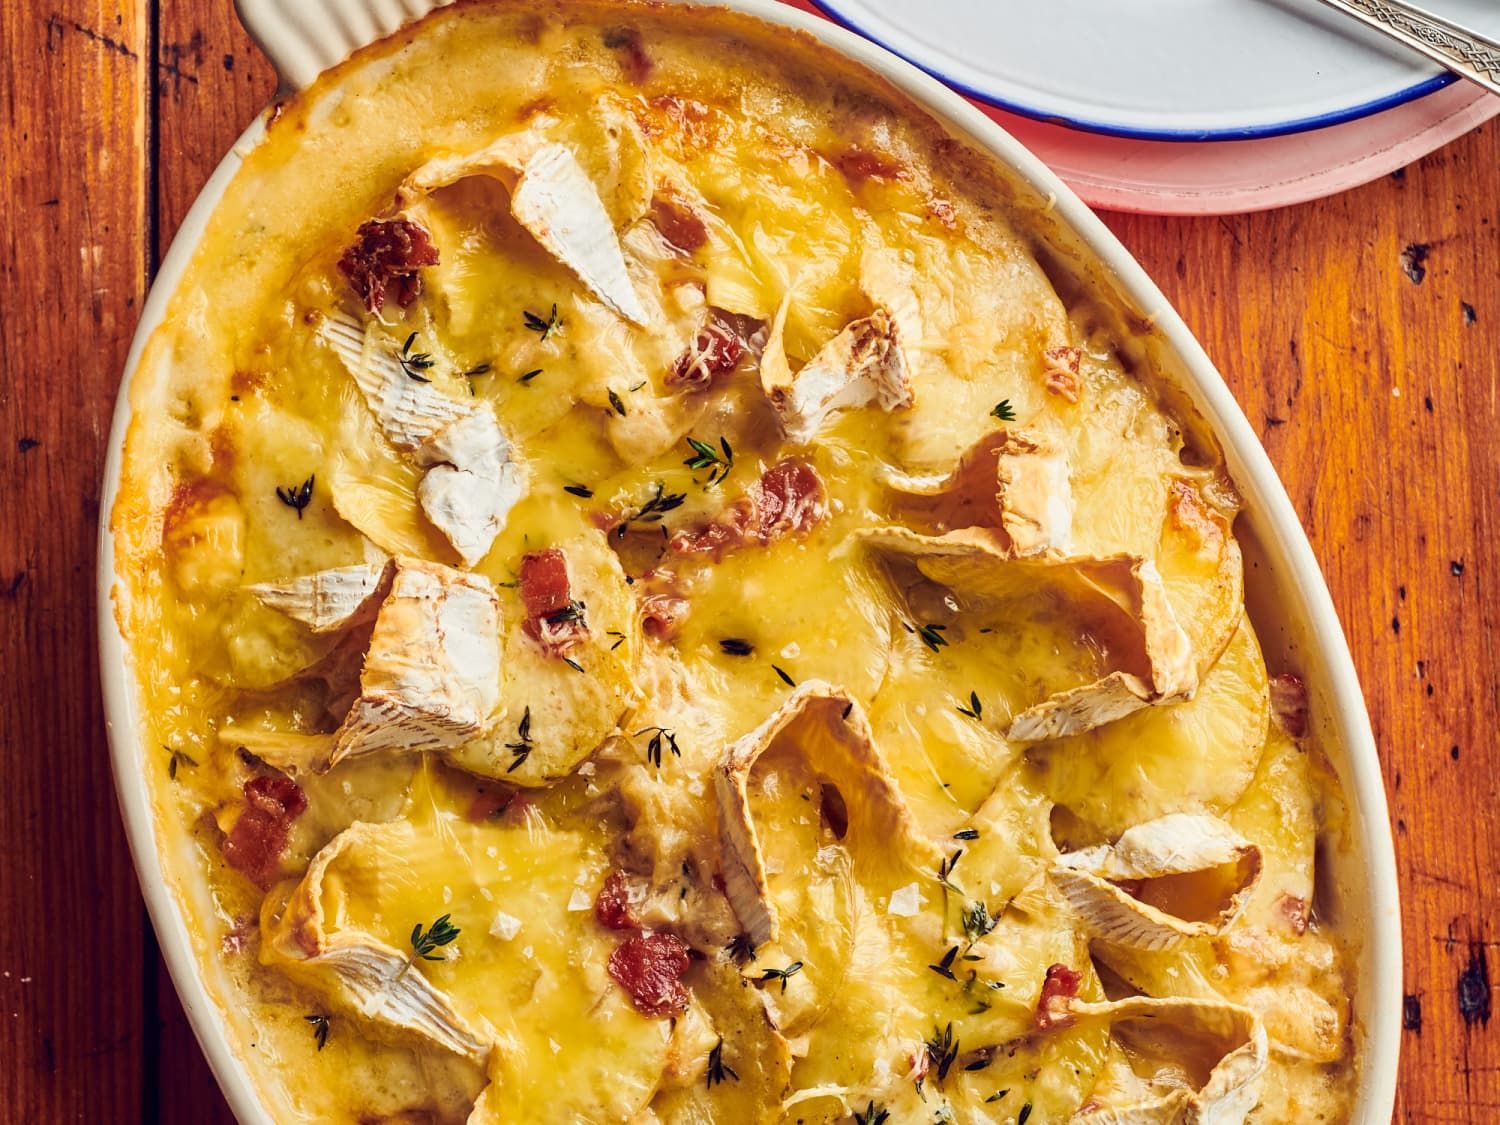 One of the most popular dishes you will find in the French Alps is Tartiflette. From the the traditional recipe to a trendy deconstructed versions, tartiflette is served in pretty much every restaurant in the alps. You can even get tartiflette pizzas!
-
 2 min readHalloween is a holiday that is celebrated on October 31st each year. It has its origins in various ancient Celtic festivals, particularly the Gaelic festival Samhain, which marked the end of the harvest season and the beginning of winter.
-
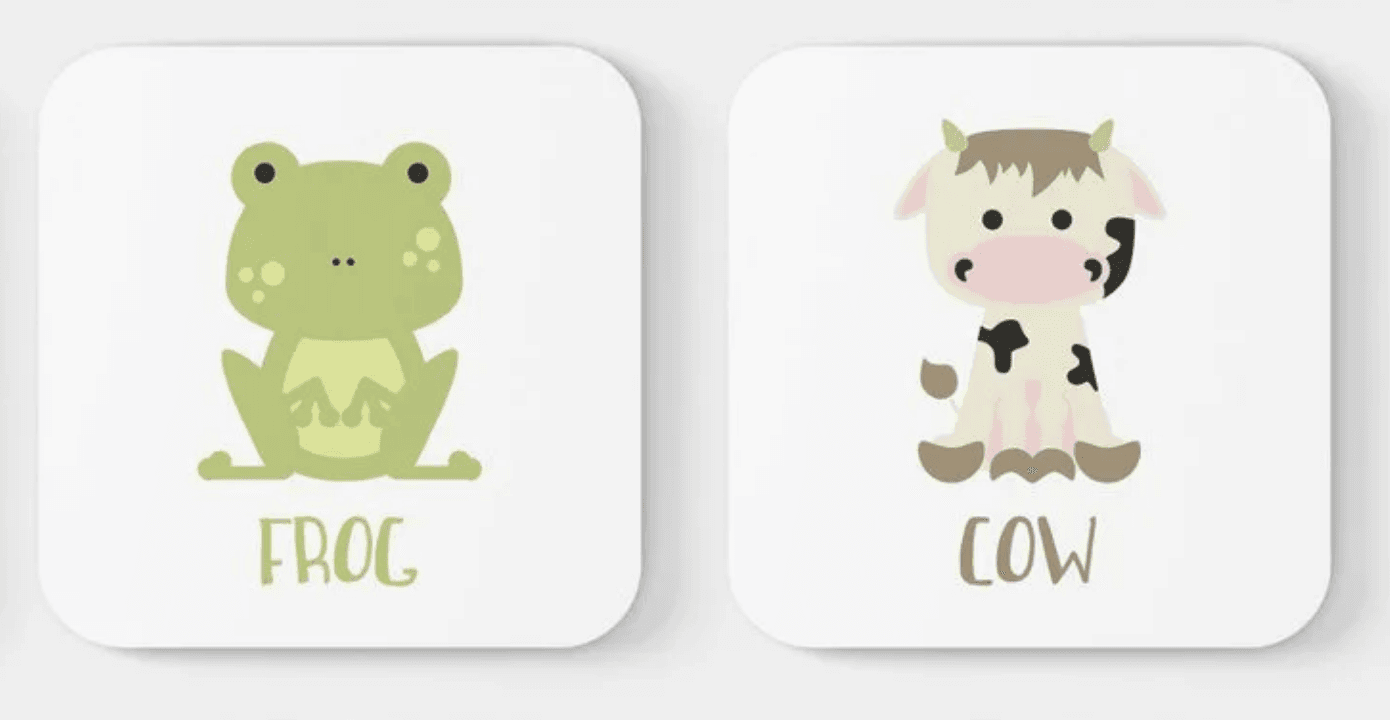 It can be extremely challenging when trying to find the perfect gift for children. It is difficult to try and keep up with their ever-changing personalities and interests. What styles are they into now? What do they like, dislike, want, and need? All of these questions can become overwhelming when trying to purchase the perfect gift. Furthermore, gift-giving expenses can begin to add up rather quickly. Therefore, by offering a gift card option, the card becomes easy to give and the child is able to select his or her own present with the allotted money. Gift cards can come in various forms including but not limited to digital, certificate, and an egift card and can even be among the cheapest gift options.
-
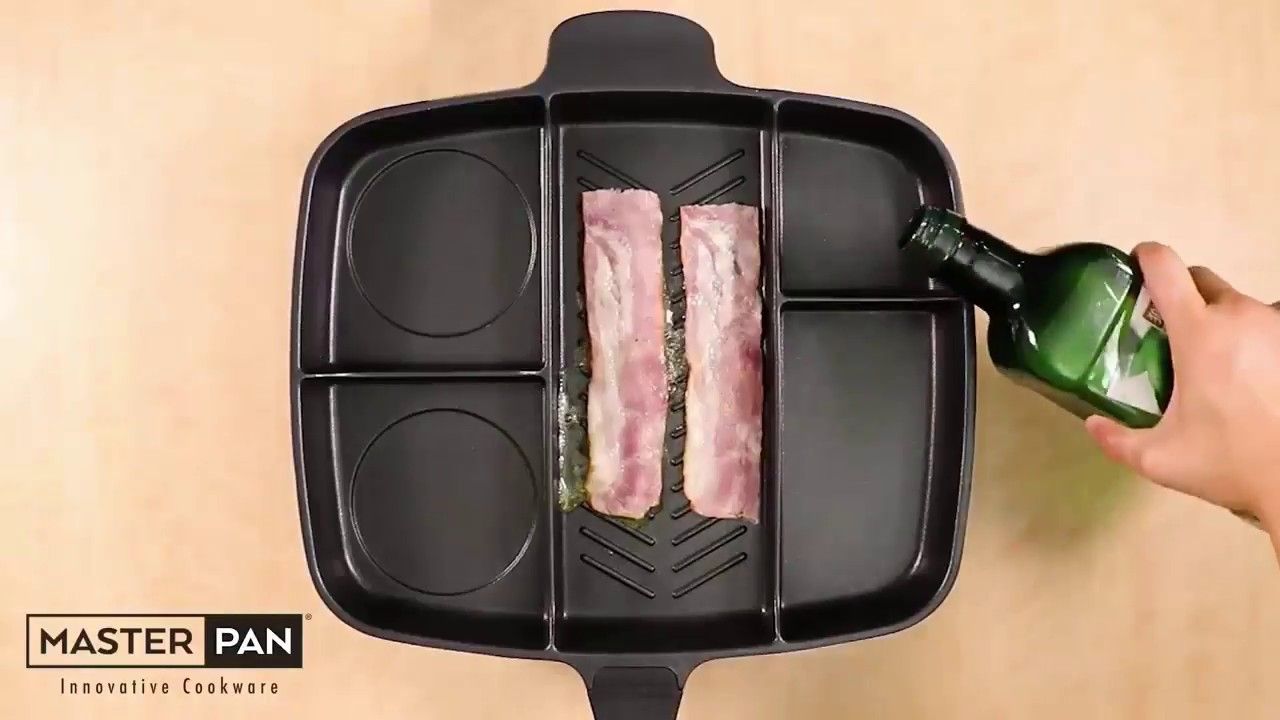 Sometimes washing up is the last thing you want to do. But, unfortunately it is a necessity, or you will be drinking out of egg cups or eating over the sink. But, there is now a way to reduce the amount of washing up, with the Masterpan.
-
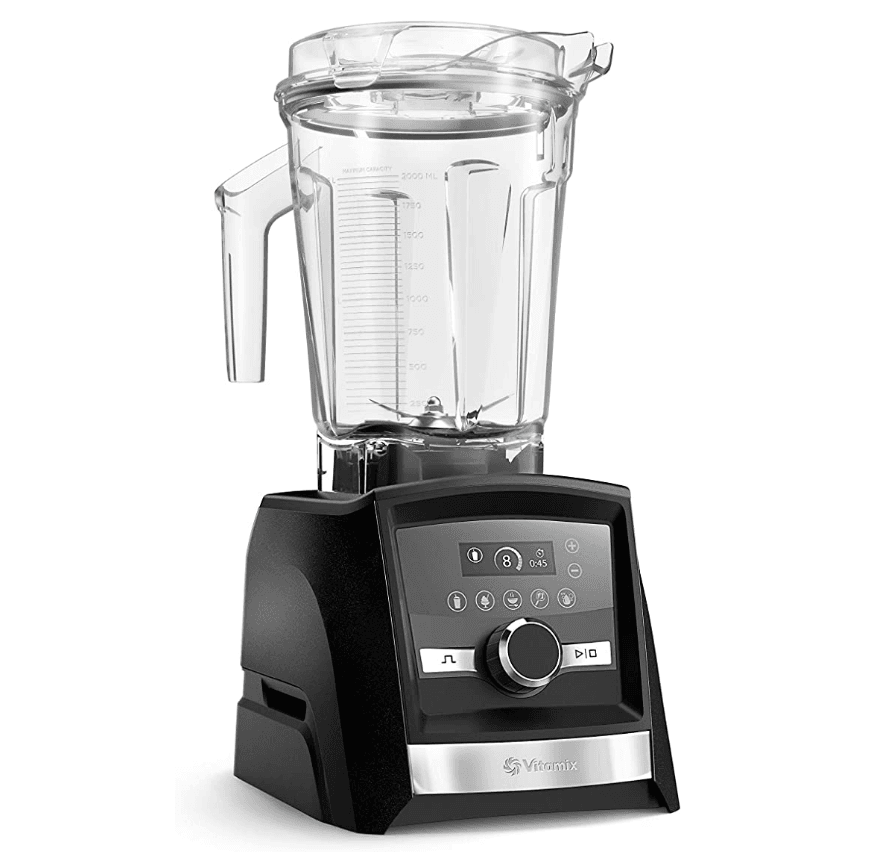 The Vitamix A3500 blender is great choice if you are searching for a good looking and high-end blender. It is the top-of-the-range model from the Ascent Series. It is easy to use, powerful and easy to clean.
-
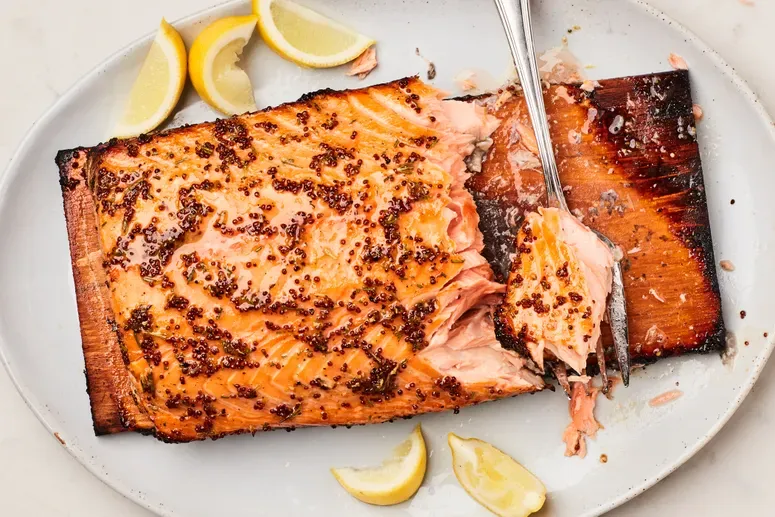 3 min readFreezing cooked fish is a convenient way to have ready-to-eat meals on hand, and it can help prevent food waste. Here's how to freeze cooked fish properly:
-
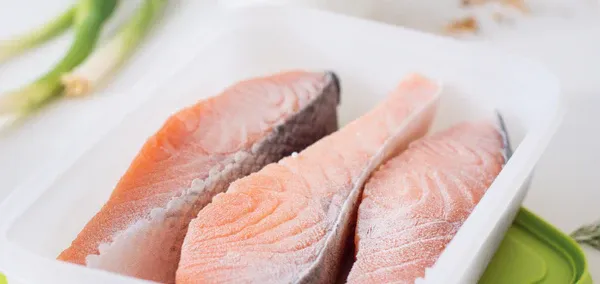 3 min readFreezing fish is a great way to preserve its freshness and extend its shelf life. Properly freezing fish can help maintain its flavor and texture. Here are the steps for the best way to freeze fish:
-
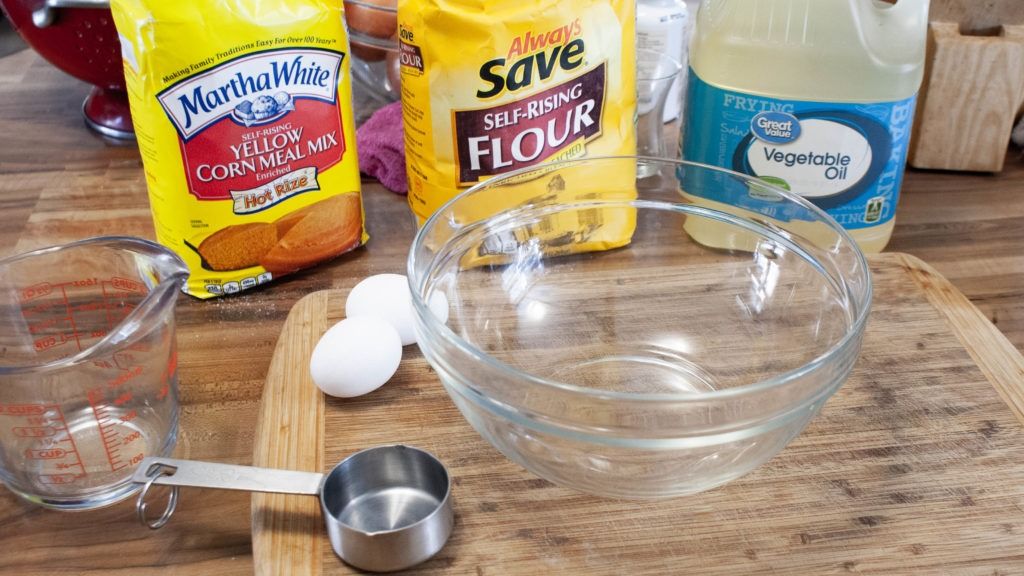 2 min readHoe cakes and johnnycakes are both traditional types of cornmeal-based pancakes, but they have some differences in their origins, preparation, and regional variations.
-
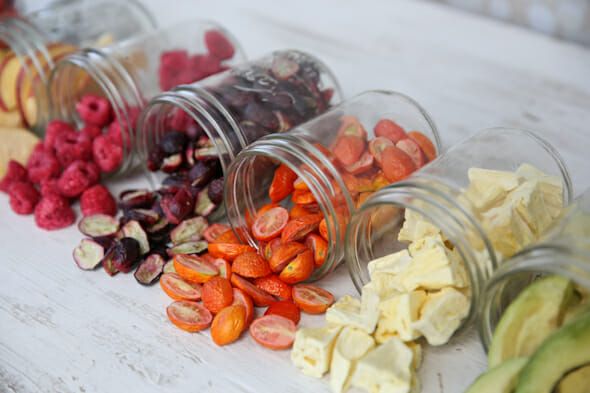 Freeze-drying is a food preservation process where food is quickly frozen, and then the ice is turned into water vapour. It is then removed by placing the frozen food in a vacuum, resulting in it being dehydrated.
-
 When you're trying to figure out the best eye cream for women over 60 you have endless options to choose from. You could go to a department store or shop online. The possibilities are everywhere, but there are a few important factors to research before making a purchase.
-
 One of the challenges of aging is ever-evolving our skin care routines with us. It can be difficult to choose the right skin care products for our needs as we age. With the right knowledge and some effort everyone can usually figure out which products will work the best for our own skin types.
-
 4 min readAs we get older, there are things we all worry about, joint pain, health care, wrinkles, and if your like me, basic skin care. With increasing age comes ever changing skin care and the never ending beauty products and routines.